Metrics
It provides visual information of application resources usage (for past 1 hour)
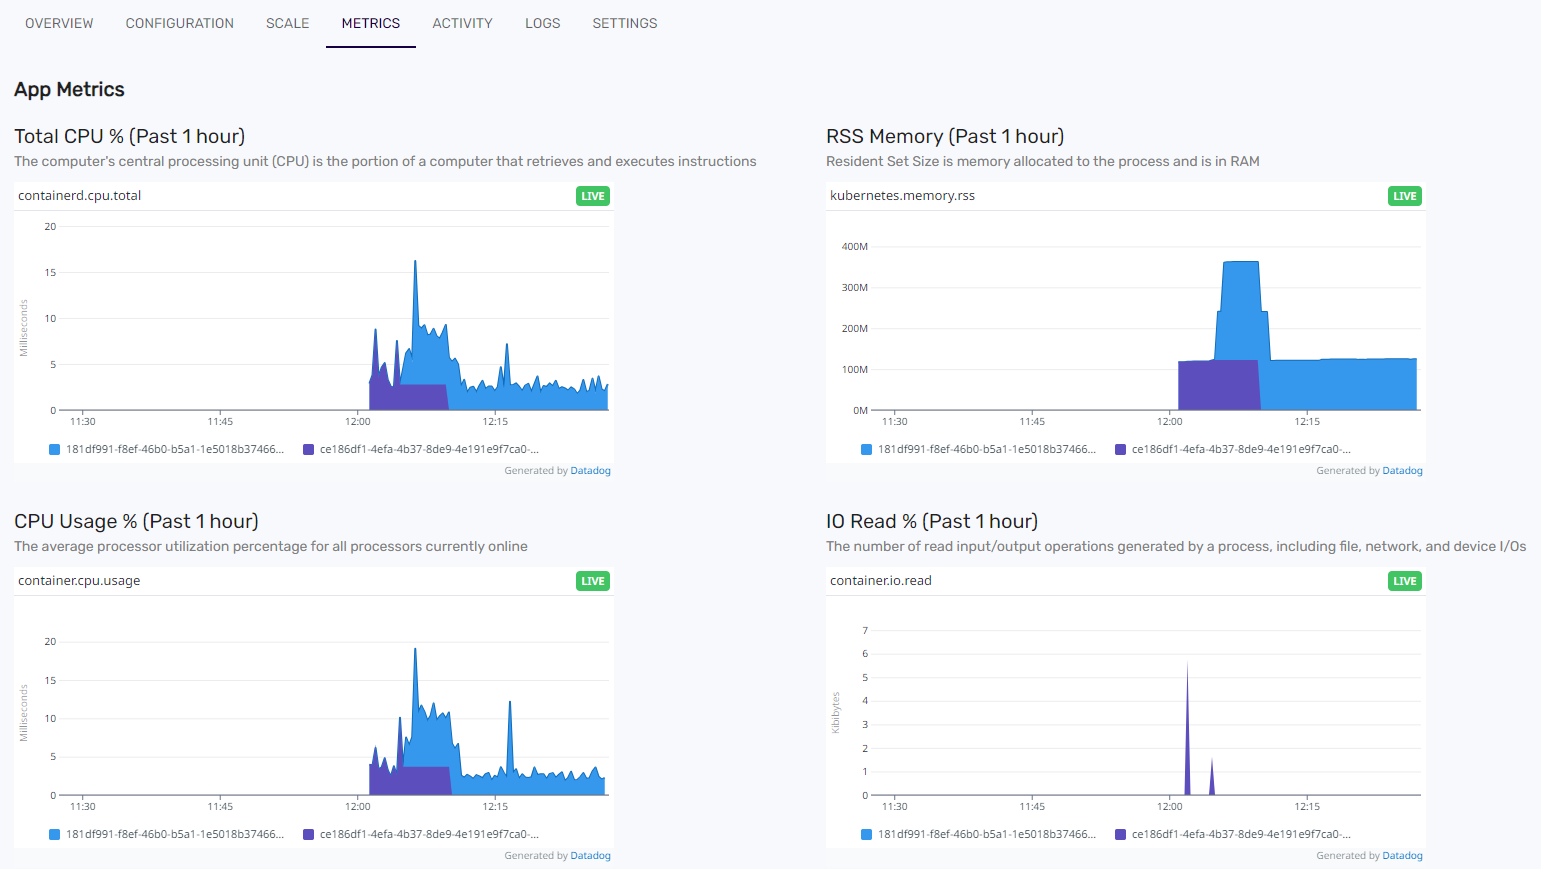
Total CPU: The computer's central processing unit (CPU) is the portion of a computer that retrieves and executes instructions
RSS Memory: Resident Set Size is memory allocated to the process and is in RAM
CPU Usage: The average processor utilization percentage for all processors currently online
IO Read: The number of read input/output operations generated by a process, including file, network, and device I/Os
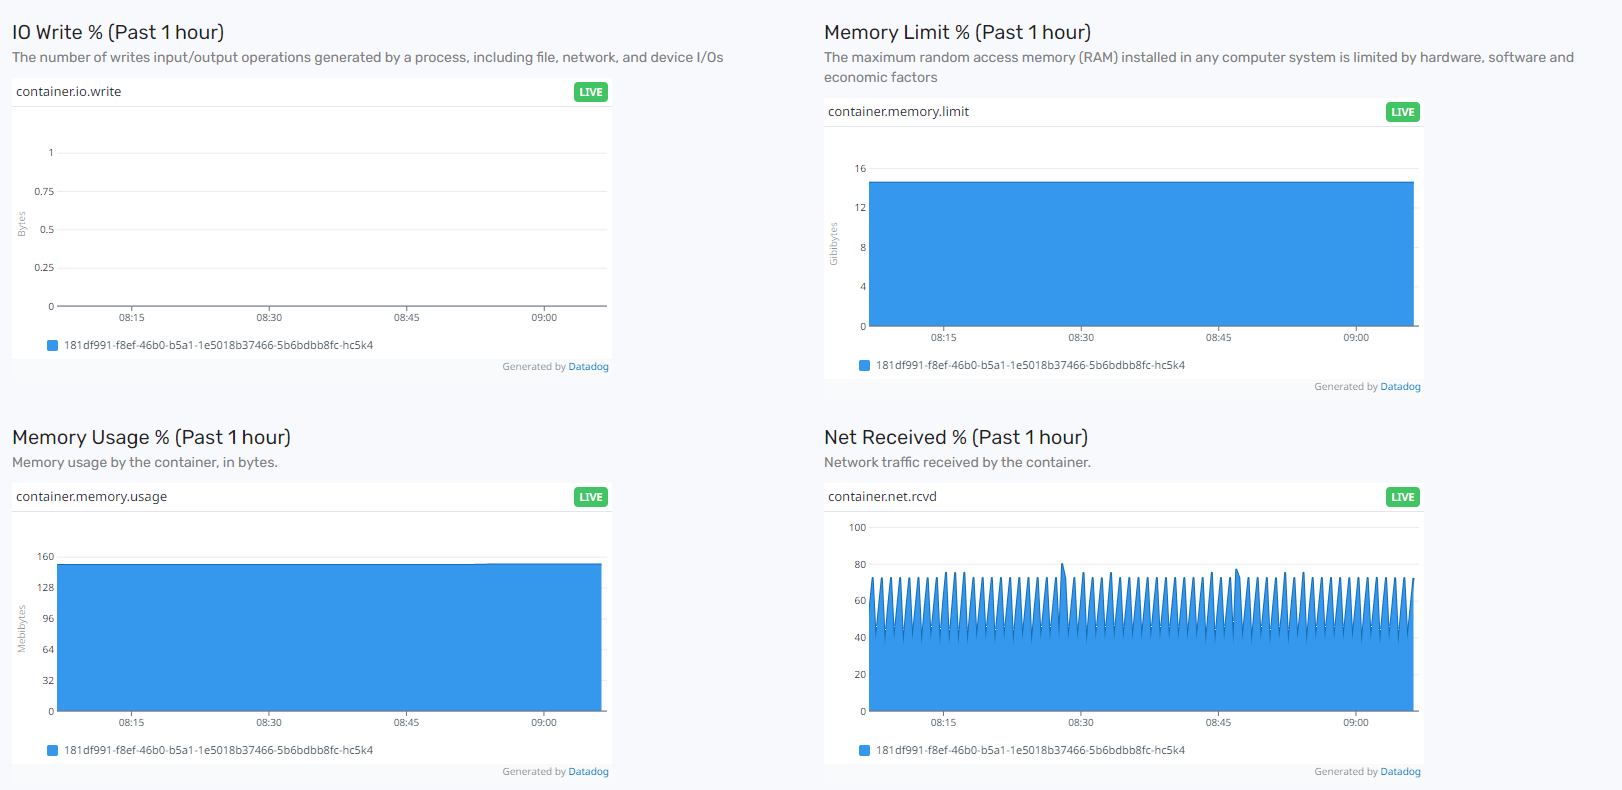
IO Write: The number of writes input/output operations generated by a process, including file, network, and device I/Os
Memory Limit: The maximum random access memory (RAM) installed in any computer system is limited by hardware, software and economic factors
Memory Usage: Memory usage by the container, in bytes.
Net Received: Network traffic received by the container.
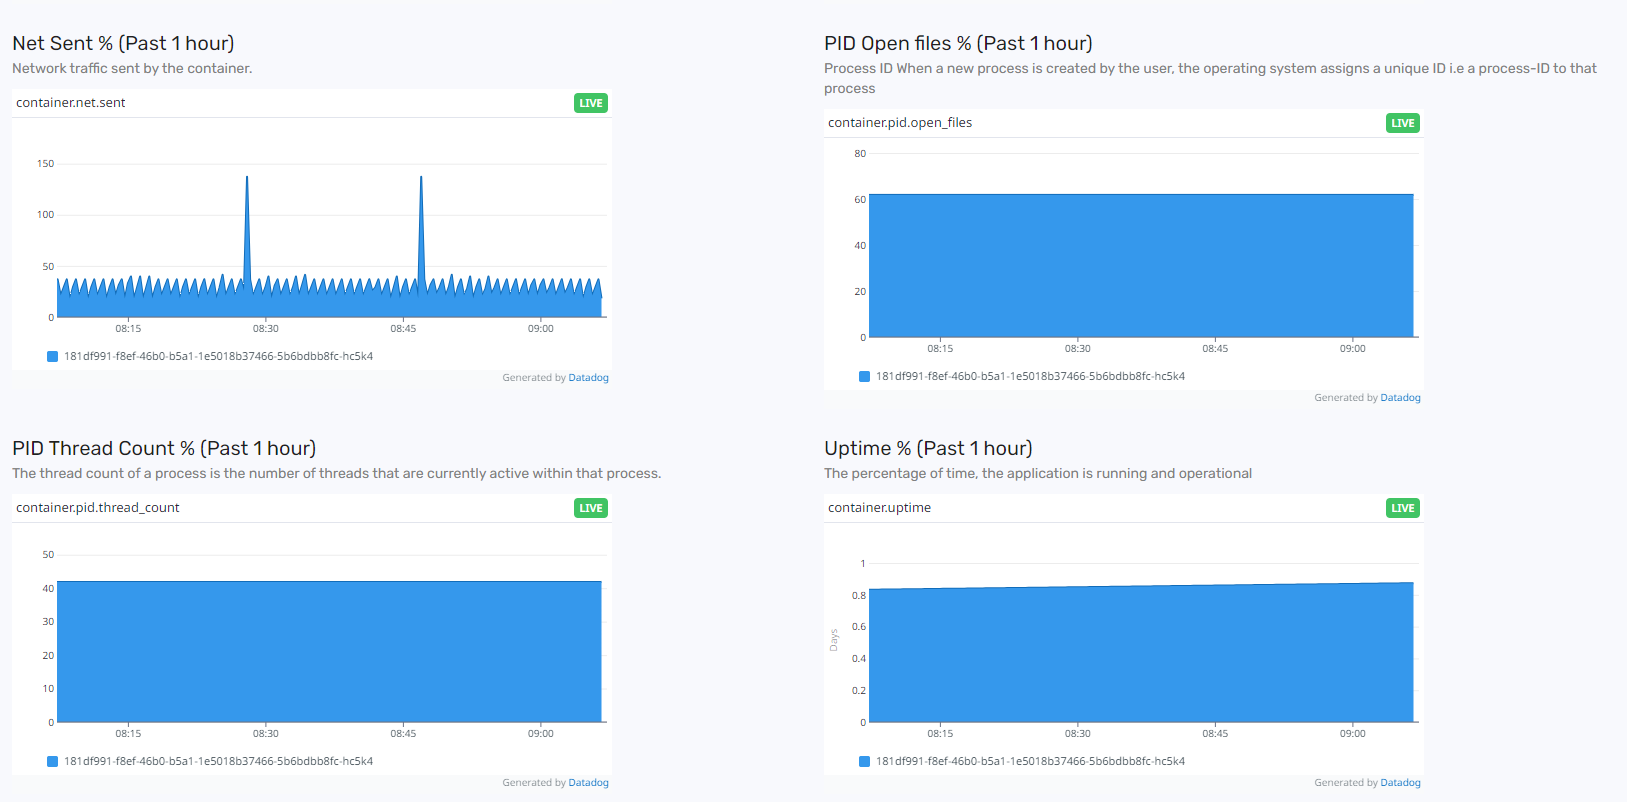
Net Sent: Network traffic sent by the container.
PID Open files: Process ID When a new process is created by the user, the operating system assigns a unique ID i.e a process-ID to that process
PID Thread Count: The thread count of a process is the number of threads that are currently active within that process.
Uptime: The percentage of time, the application is running and operational
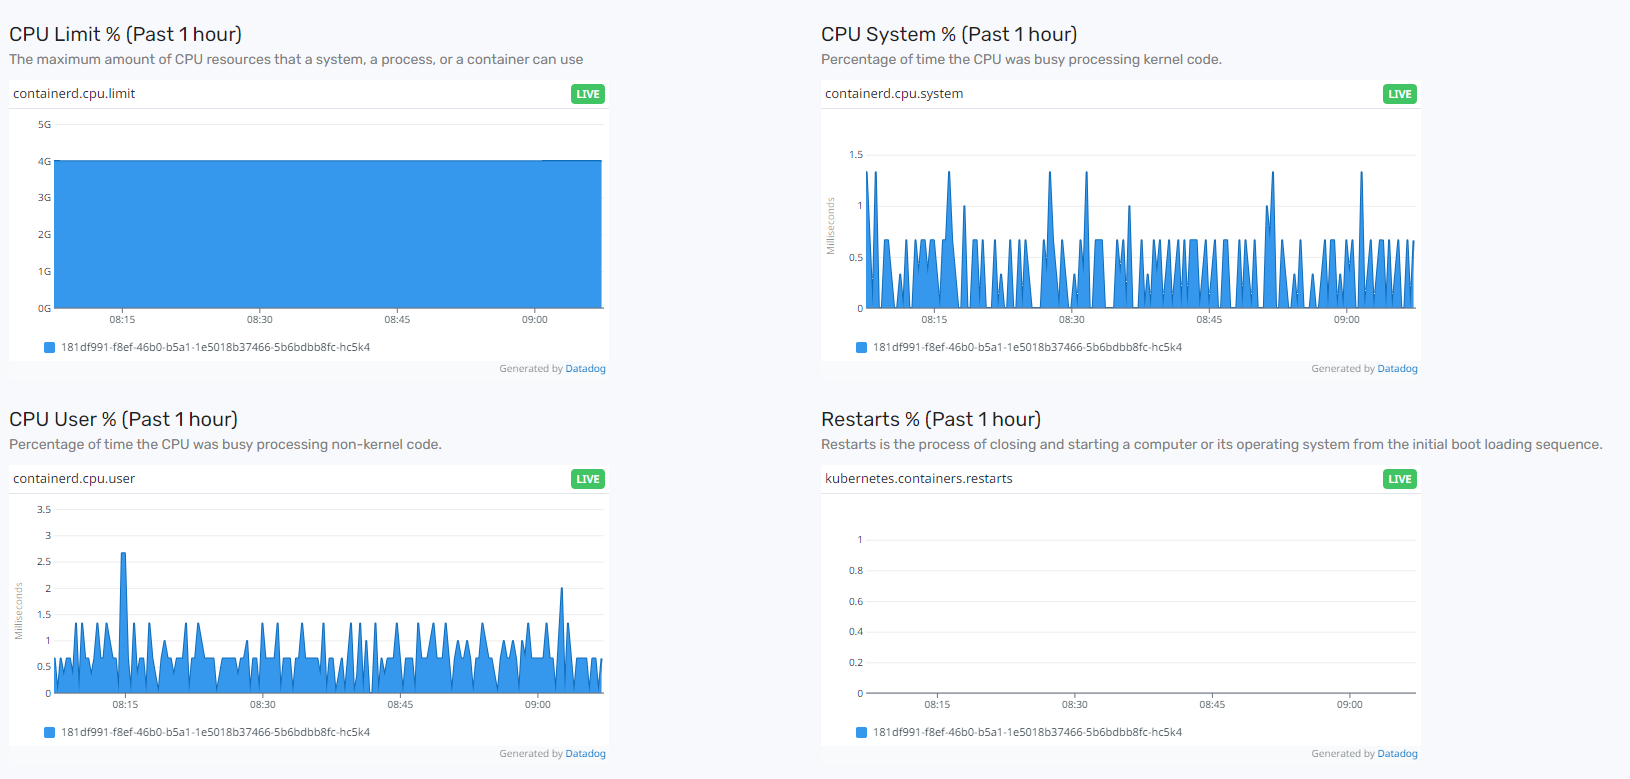
CPU Limit: The maximum amount of CPU resources that a system, a process, or a container can use.
CPU System: Percentage of time the CPU was busy processing kernel code.
CPU User: Percentage of time the CPU was busy processing non-kernel code.
Restarts: Restarts is the process of closing and starting a computer or its operating system from the initial boot loading sequence.
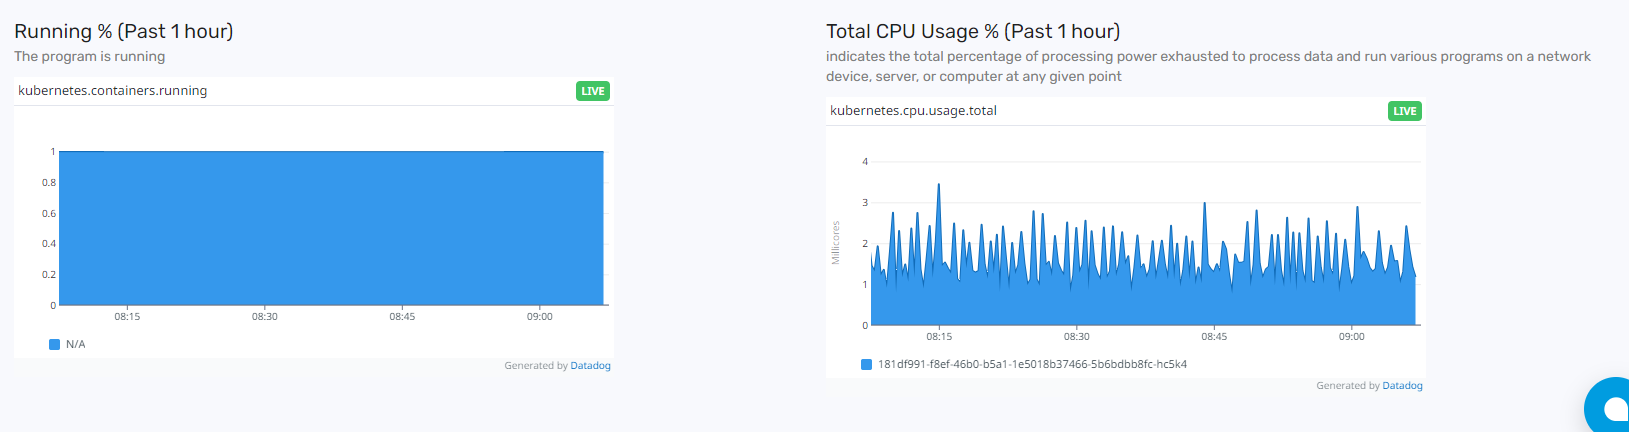
Running: The program is running.
Total CPU Usage: Indicates the total percentage of processing power exhausted to process data and run various programs on a network device, server, or computer at any given point